- JavaScript 58%
- HTML 41.5%
- CSS 0.5%
| highcharts-assets | ||
| src | ||
| .gitignore | ||
| .npmignore | ||
| babel.config.js | ||
| CODE_OF_CONDUCT.md | ||
| LICENSE.md | ||
| package-lock.json | ||
| package.json | ||
| README.md | ||
| sanity.json | ||
| screen1.png | ||
| screen2.png | ||
Highcharts editor input plugin for Sanity CMS
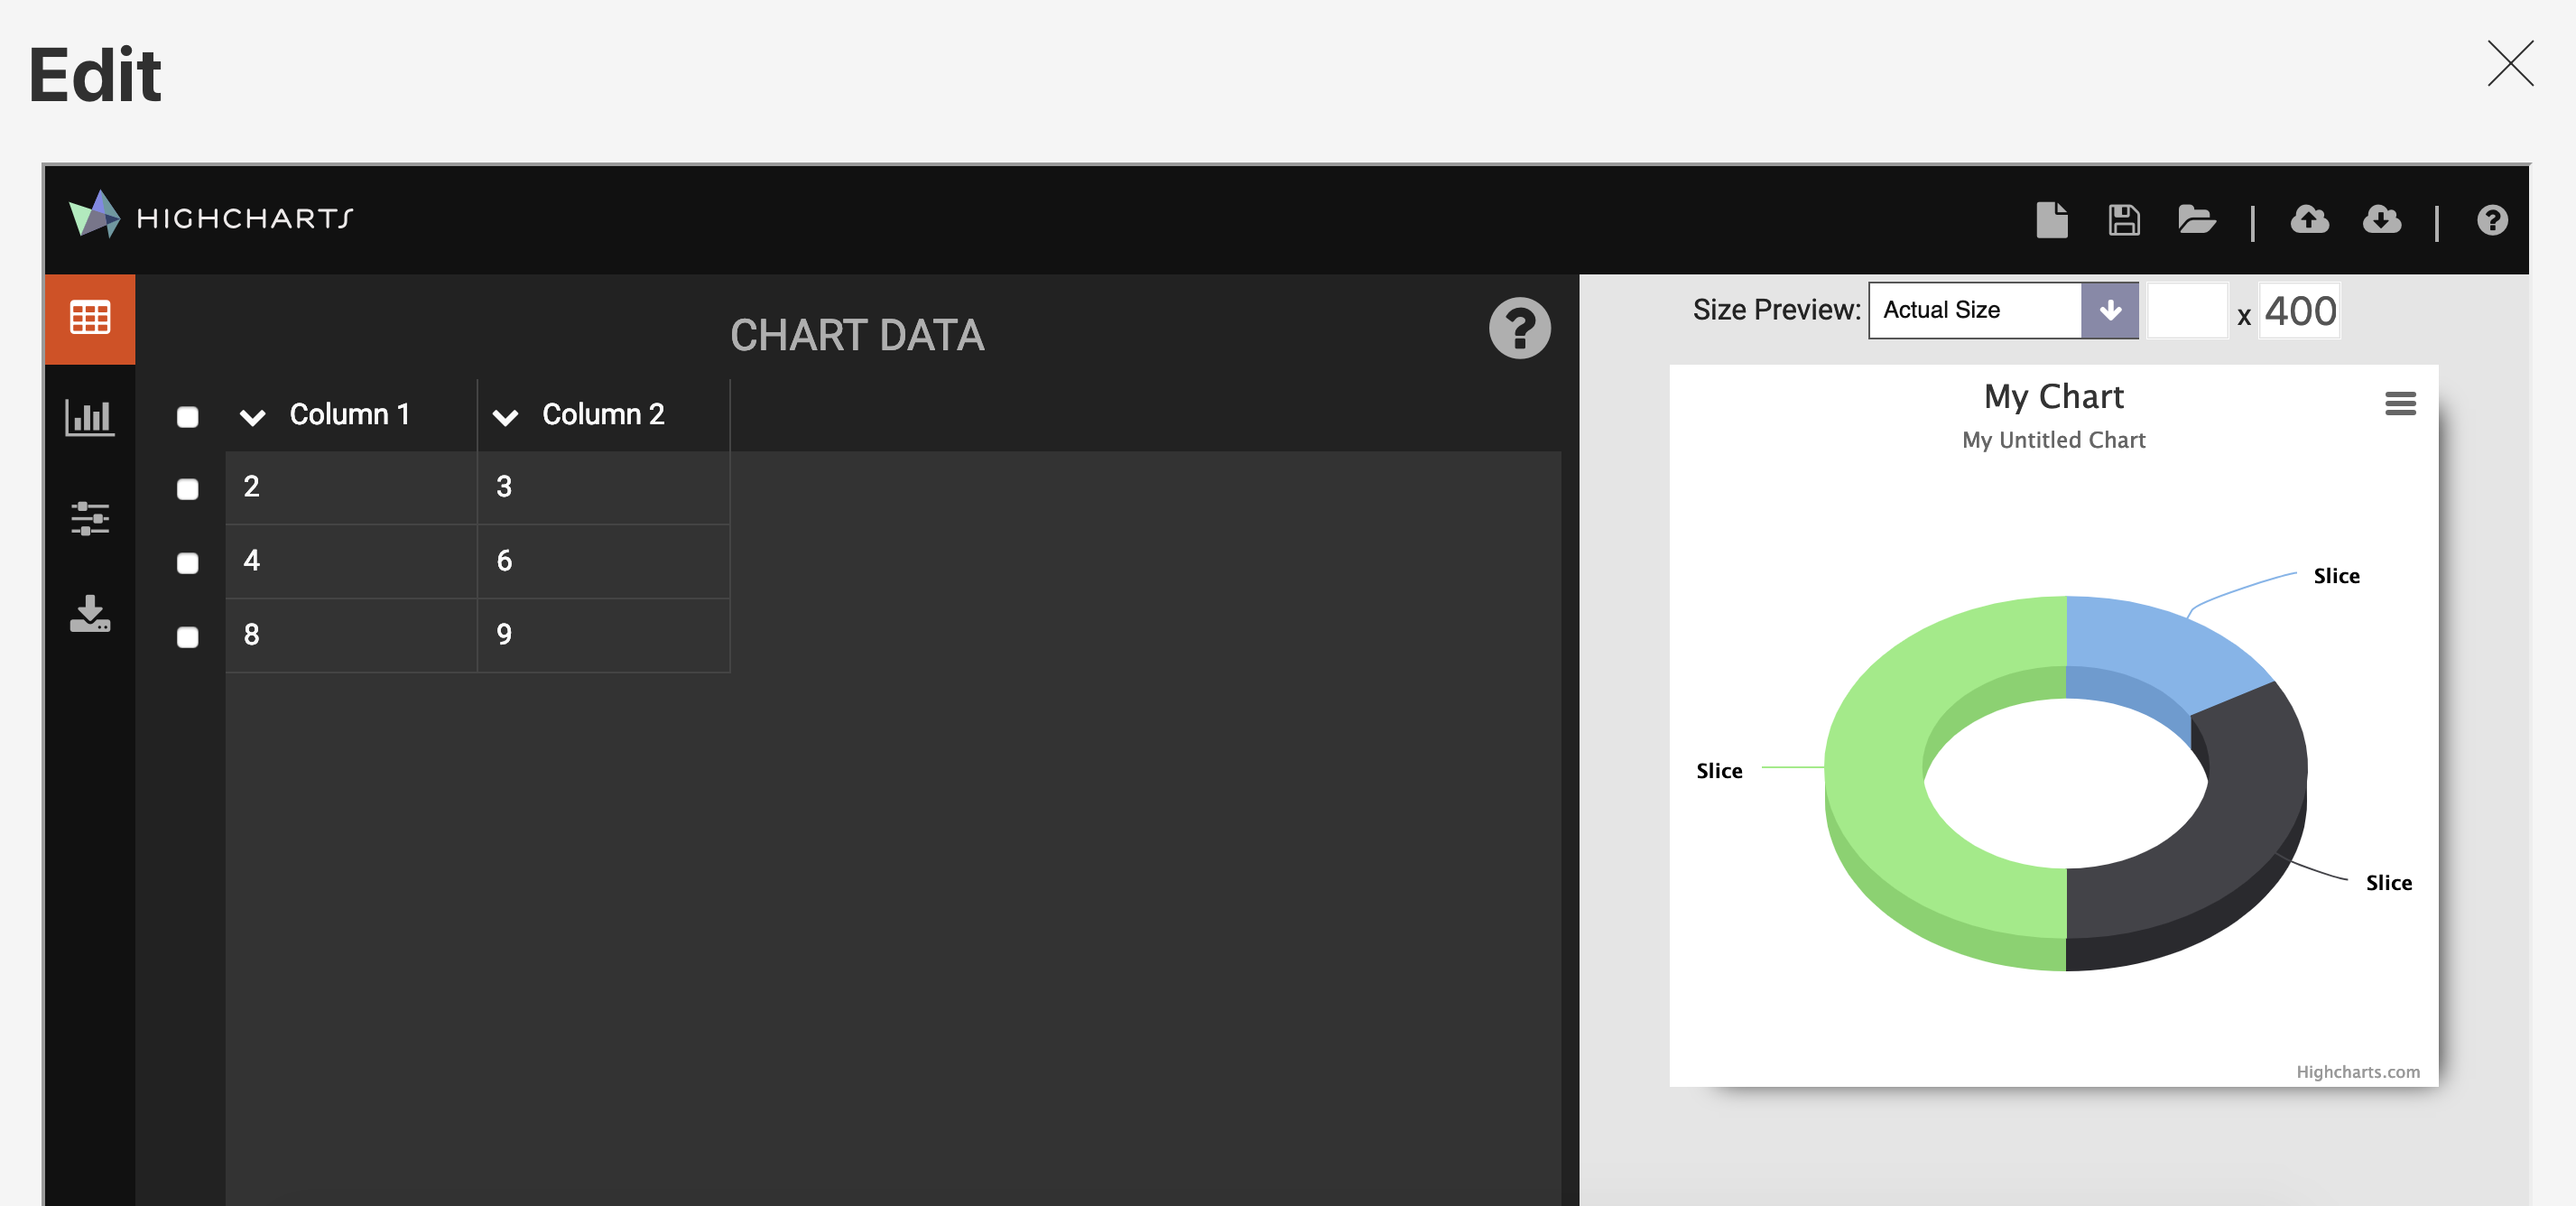
![]()
This plugin let's you embed the Highcharts Editor within Sanity. Learn how I did it here.
Installation
- Run
sanity install highcharts-editorto install the plugin. - Copy the
highcharts-assets/folder into your Sanity project's static folder like so/static/highcharts-assets/. - Run
sanity start
Usage
Prerequisite: Knowledge of how Sanity does rich text.
After installing the plugin. In your schema where you define block content you can add:
export default {
  name: "content",
  type: "array",
  title: "Content",
  of: [
    {
      type: "block"
    },
    {
      type: "highcharts"
    }
  ]
};
If all works correctly you should now be able to create charts with the Sanity studio.
See HighchartsType.js, to see what data fields is saved.
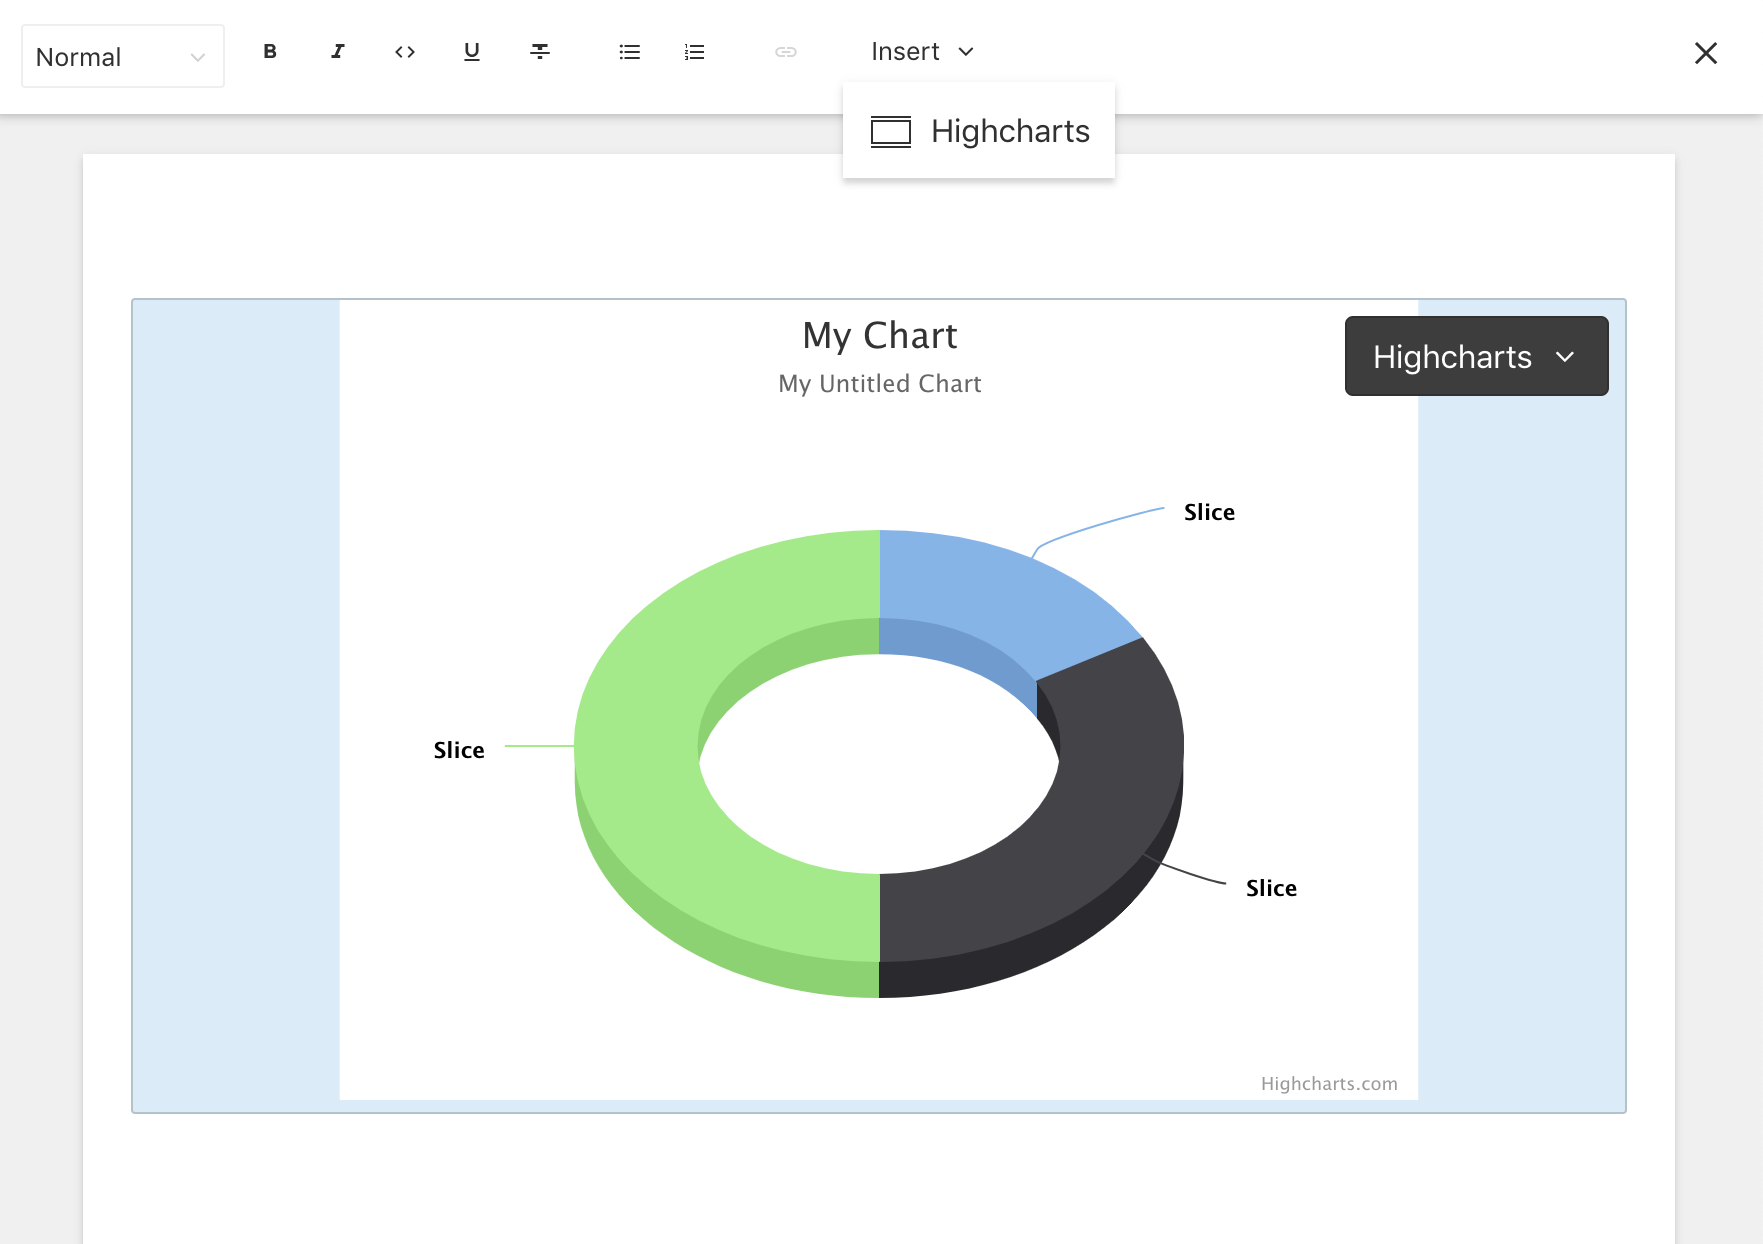
How to display the chart
Prerequisite: Knowledge of presenting portable text. Based on the serializer example found there, we can add a serializer that either outputs svgStr directly, or outputs jsonStr with HighchartsReact like so:
import React from "react";
import ReactDOM from "react-dom";
import Highcharts from "highcharts";
import HighchartsReact from "highcharts-react-official";
import BlockContent from "@sanity/block-content-to-react";
import initSanityClient from "@sanity/client";

const client = initSanityClient({
  projectId: "<your project id>",
  dataset: "<some dataset>",
  useCdn: true
});

const serializers = {
  types: {
    highcharts: ({ node: { jsonStr = "" } = {} }) => {
      try {
        const options = JSON.parse(jsonStr);
        return <HighchartsReact highcharts={Highcharts} options={options} />;
      } catch (e) {
        console.log("Failed to load highcharts options", e);
      }
    }
  }
};

client.fetch('*[_type == "post"][0]').then(post => {
  ReactDOM.render(
    <BlockContent blocks={post.content} serializers={serializers} />,
    document.getElementById("root")
  );
});
License
This plugin is licensed under the MIT license.
Please note: While the Highcharts editor is MIT licensed, Highcharts.js itself requires a paid license. If you're a non-profit organization you can apply to get a free license.
Code of Conduct
This project is released with a Contributor Code of Conduct. By participating in this project you agree to abide by its terms.